
Latest Real Estate Trend Charts August 2016
Here is a link to our latest trend updates through August for Cape Coral real estate. Inventory for single family is down by approximately 2% since same period last year. As was true last month, the inventory is tightest in lower priced homes. Sales volume for single family homes is down 5.1% compared to the sales levels a year ago.
Off water homes median sale price is up 15.4% over last year (4 month average vs last year). Reduced inventory is pushing up prices. The sales volume was down 4.6%. Inventory of off water homes is the tightest with a 4.1 month supply. This is what continues to fuel the year over year median price increase.

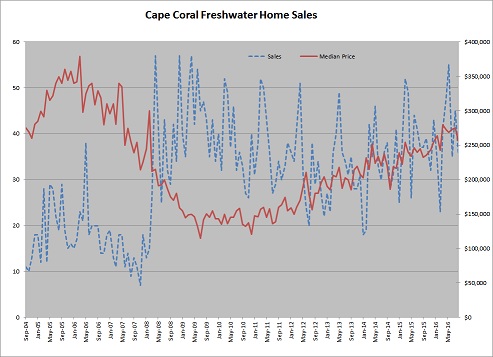
Freshwater homes median sale price is up 11.2% over last year. Volume was up 15.5%. There is currently a 6.2 month supply of homes.
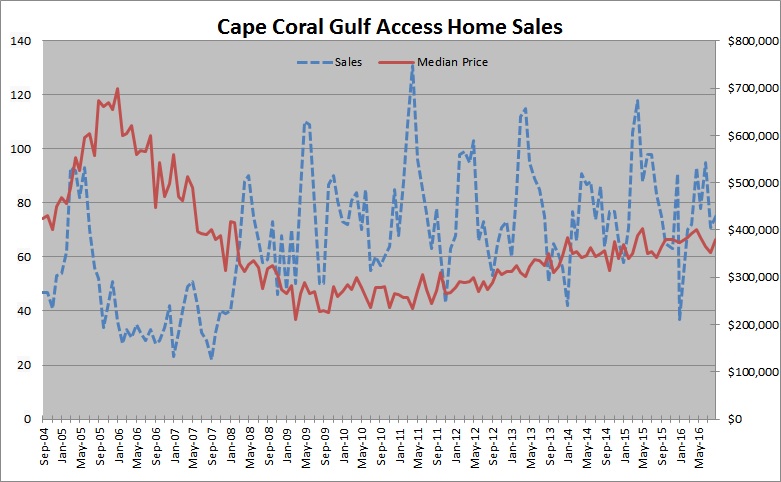
Gulf access homes median sale price is up 2.2% over last years same 4 month period. Sales volume was down 13.1%. The gulf access home segment of our market has the highest unsold inventory rate with 9.2 months of inventory. This inventory level has slowed the rate of home sale price increase.
We believe you will find our trend charts very informative. Click on the link below to access our Real Estate Resource Site to view this series of market component trend charts including trend charts for land sales.
Call Ross Winchel at 239-898-1214 or email at Ross.Winchel@gmail.com
Broker/Associate
Koffman and Associates
Century 21 Sunbelt Realty


